If you’re running ecommerce in 2026, the issue usually isn’t a lack of data. It’s that the data you need to make decisions is scattered.
Orders live in Shopify. Marketplace performance lives in Amazon and Walmart platforms. Ads live in Amazon Ads, Walmart Connect, Meta, and Google. Profitability tends to end up in spreadsheets. Every team pulls a different report and it can leave you debating numbers instead of making decisions.
That’s what ecommerce & marketplace analytics software is supposed to fix. It brings customer, product, channel, and revenue signals into one place so you can see what’s driving growth and what’s quietly dragging it down.
If you sell on Amazon or Walmart, you need to treat marketplace analytics as a separate category from web analytics because it answers different questions.
Key Takeaways
- Most ecommerce teams fail to move fast because data is scattered across Shopify, Amazon, Walmart, ads, and spreadsheets.
- Ecommerce and marketplace analytics software unifies performance so marketing, ops, and leadership stop debating numbers and start acting.
- If Amazon and Walmart are core channels, you need marketplace focused analytics, not just GA4 or generic BI.
- For teams that rely on Amazon and Walmart, DataHawk is built specifically for marketplace analytics, including dashboards, alerts, keyword visibility tracking, and competitive intelligence.
- Shopify-focused tools can be great, but they often miss retail search, share of voice, and competitive benchmarking on marketplaces.
What is ecommerce & marketplace analytics software in 2026?
Ecommerce and marketplace analytics software pulls data from your commerce stack and turns it into a single view of performance. That usually includes:
- Revenue and orders
- Marketing performance and attribution
- Customer and product performance
- Inventory and operations signals
- Profitability and forecasting
Marketplace analytics focuses on discoverability and conversion on the digital shelf. It covers keyword visibility, content quality, share of voice, price and availability changes, and how competitors shift in the category.
It adds what web analytics can’t:
- Retail search performance and keyword ranks
- Category dynamics and competitor benchmarking
- Digital shelf visibility across listings
- Marketplace-specific content and operational signals
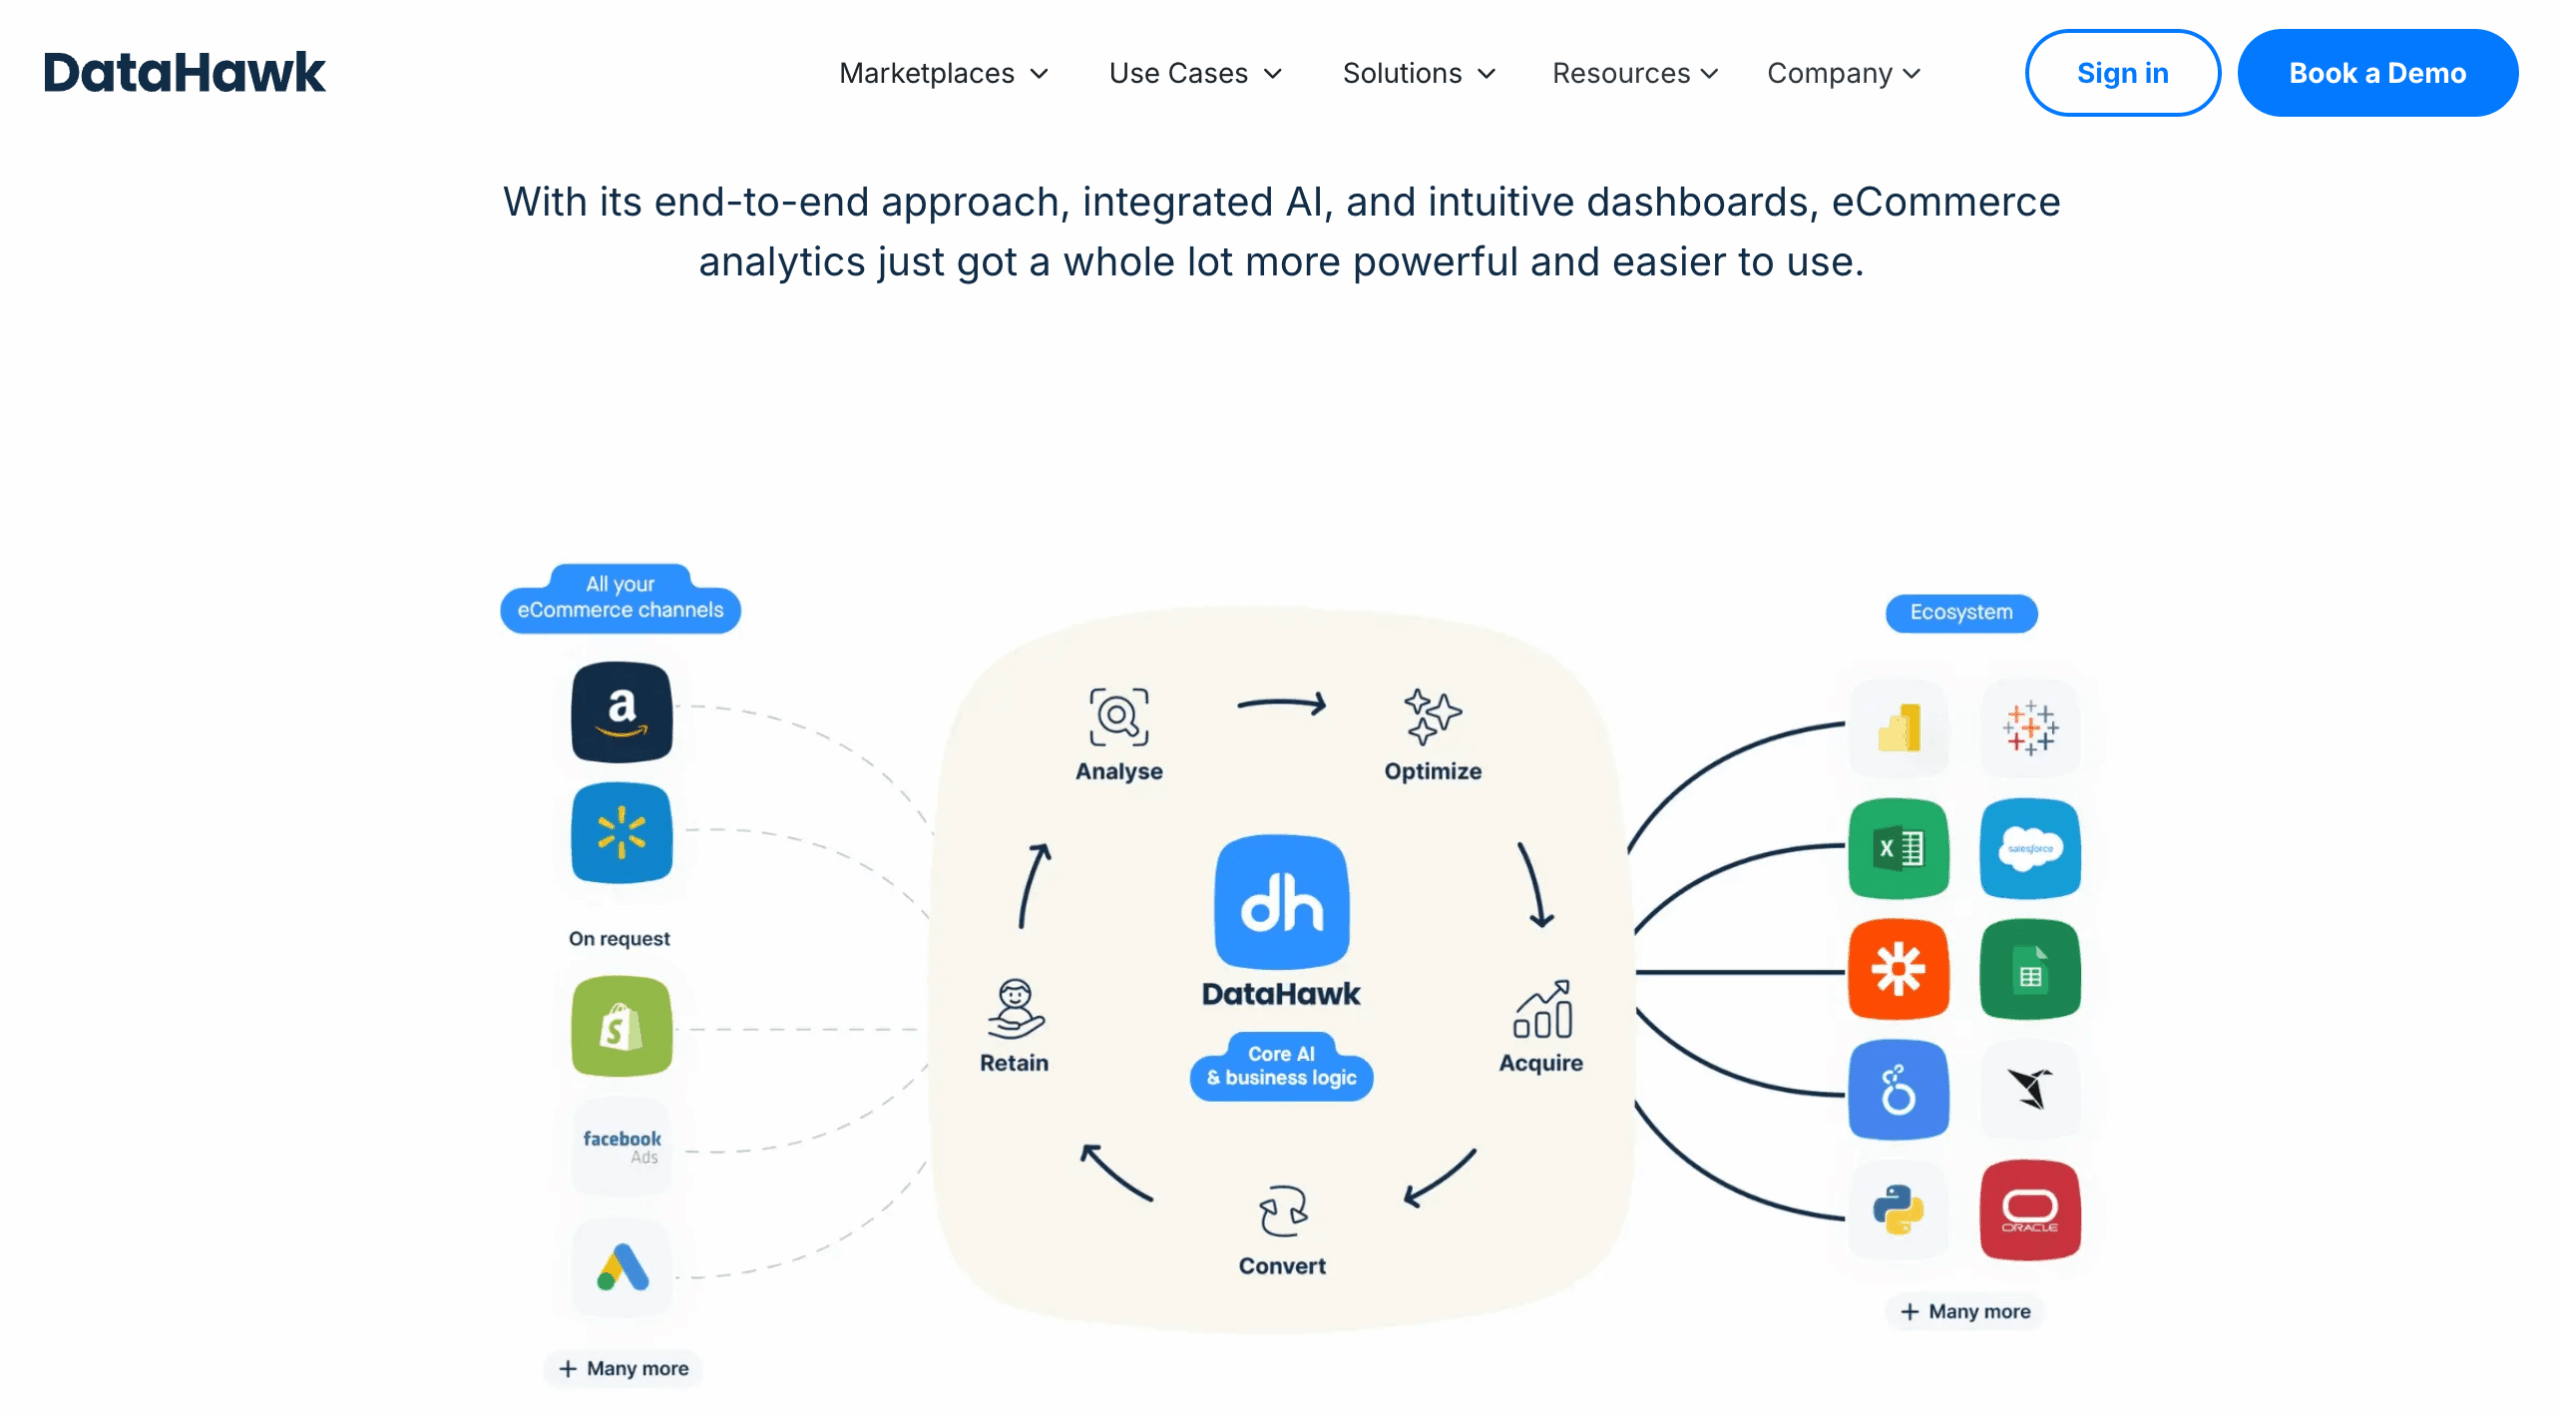
DataHawk is marketplace focused analytics. It brings together sales, advertising, keyword, and other digital shelf data, so teams can grow revenue and market share.
Who should use ecommerce and marketplace analytics software?
The teams below tend to benefit the fastest because they need the same numbers to make coordinated decisions.
| Who it’s for | Why they need it | What they get |
| Marketing and growth | Their data lives across too many platforms, so decisions drift toward ROAS instead of profit and long term value. | A single view of channel performance tied to revenue and profitability, so budgets go to what actually drives growth. |
| Marketplace and retail media | Amazon and Walmart performance depends on retail search visibility, listing quality, and competitor movement, not just ad spend. | Retail search and digital shelf visibility, competitor context, and clear signals on what changed and what to fix. |
| Merchandising and product | They need SKU level clarity to make smart calls on pricing, promos, and assortment across marketplaces and Shopify. | SKU performance trends, category insights, and better inputs for inventory and merchandising decisions. |
| Operations | Stock and fulfillment issues quietly kill revenue and ad efficiency, usually before anyone notices. | Early visibility into risks and issues so they can prevent revenue loss instead of reacting after the fact. |
| Finance and leadership | They need consistent numbers and clean reporting when fees, ads, returns, and marketplaces complicate profitability. | Trustworthy reporting, clearer margin and profit views without spreadsheet chaos. |
How we evaluated these tools
We looked at data coverage, ecommerce depth, and how usable the insights are for real teams. We also separated tools built for marketplace reality from tools built for site behavior, attribution, pipelines, or experimentation.
Top 10 ecommerce & marketplace analytics software in 2026
A lot of tools promise complete visibility. Most only give you part of the picture. In 2026, the real split is between platforms built for on-site behavior and DTC reporting, and platforms built for marketplace reality. If you sell on Amazon and Walmart, you need analytics that understands retail search, digital shelf performance, and competitor shifts, not just sessions and clicks.
Think of ecommerce analytics as three layers: marketplace analytics (Amazon/Walmart), DTC analytics (Shopify + attribution), and supporting tools (web/product behavior, experimentation, and data pipelines). Most teams use at least two layers.
Below is a quick overview of the top ecommerce & marketplace analytics software in 2026, based on data coverage, ecommerce depth, and how well each tool supports decisions across marketplaces.
| Tool | What it is best known for |
| DataHawk | Enterprise-grade marketplace analytics for Amazon & Walmart. White label dashboards, alerts, and AI-powered insights. |
| GA4 | Web and app behavior tracking |
| Triple Whale | Shopify first DTC analytics and attribution |
| Glew | Broad ecommerce dashboards for mid market teams |
| Adobe Analytics | Enterprise digital analytics with heavy customization |
| Mixpanel | Event and product analytics |
| Matomo | Privacy first web analytics |
| Supermetrics | Data pipelines into BI tools, not a full analytics layer |
| Optimizely | Experimentation and testing analytics |
| Woopra | Journey and lifecycle tracking |
Comparing the top ecommerce analytics platforms in 2026
DataHawk
Best for:
Teams running enterprise level Amazon and Walmart programs who need one place to monitor performance, quickly identify issues, and present clean reports to leadership. It is built for brands, advertisers, agencies, and the executives and vendor partners teams managing multiple accounts and large catalogs.
Pricing: Custom pricing with annual plans tailored to your business, so you only pay for what fuels your growth.
Key features:
- Executive ready dashboards built for marketplace performance reporting.
- Daily performance alerts with AI powered insights.
- Monitoring across sales, ads, SEO, and inventory for Amazon and Walmart.
- Analyzing Amazon markets with access to sales estimates and market share evolution reports
- Agency support including multi account dashboards, white label reports, and role based access.
GA4
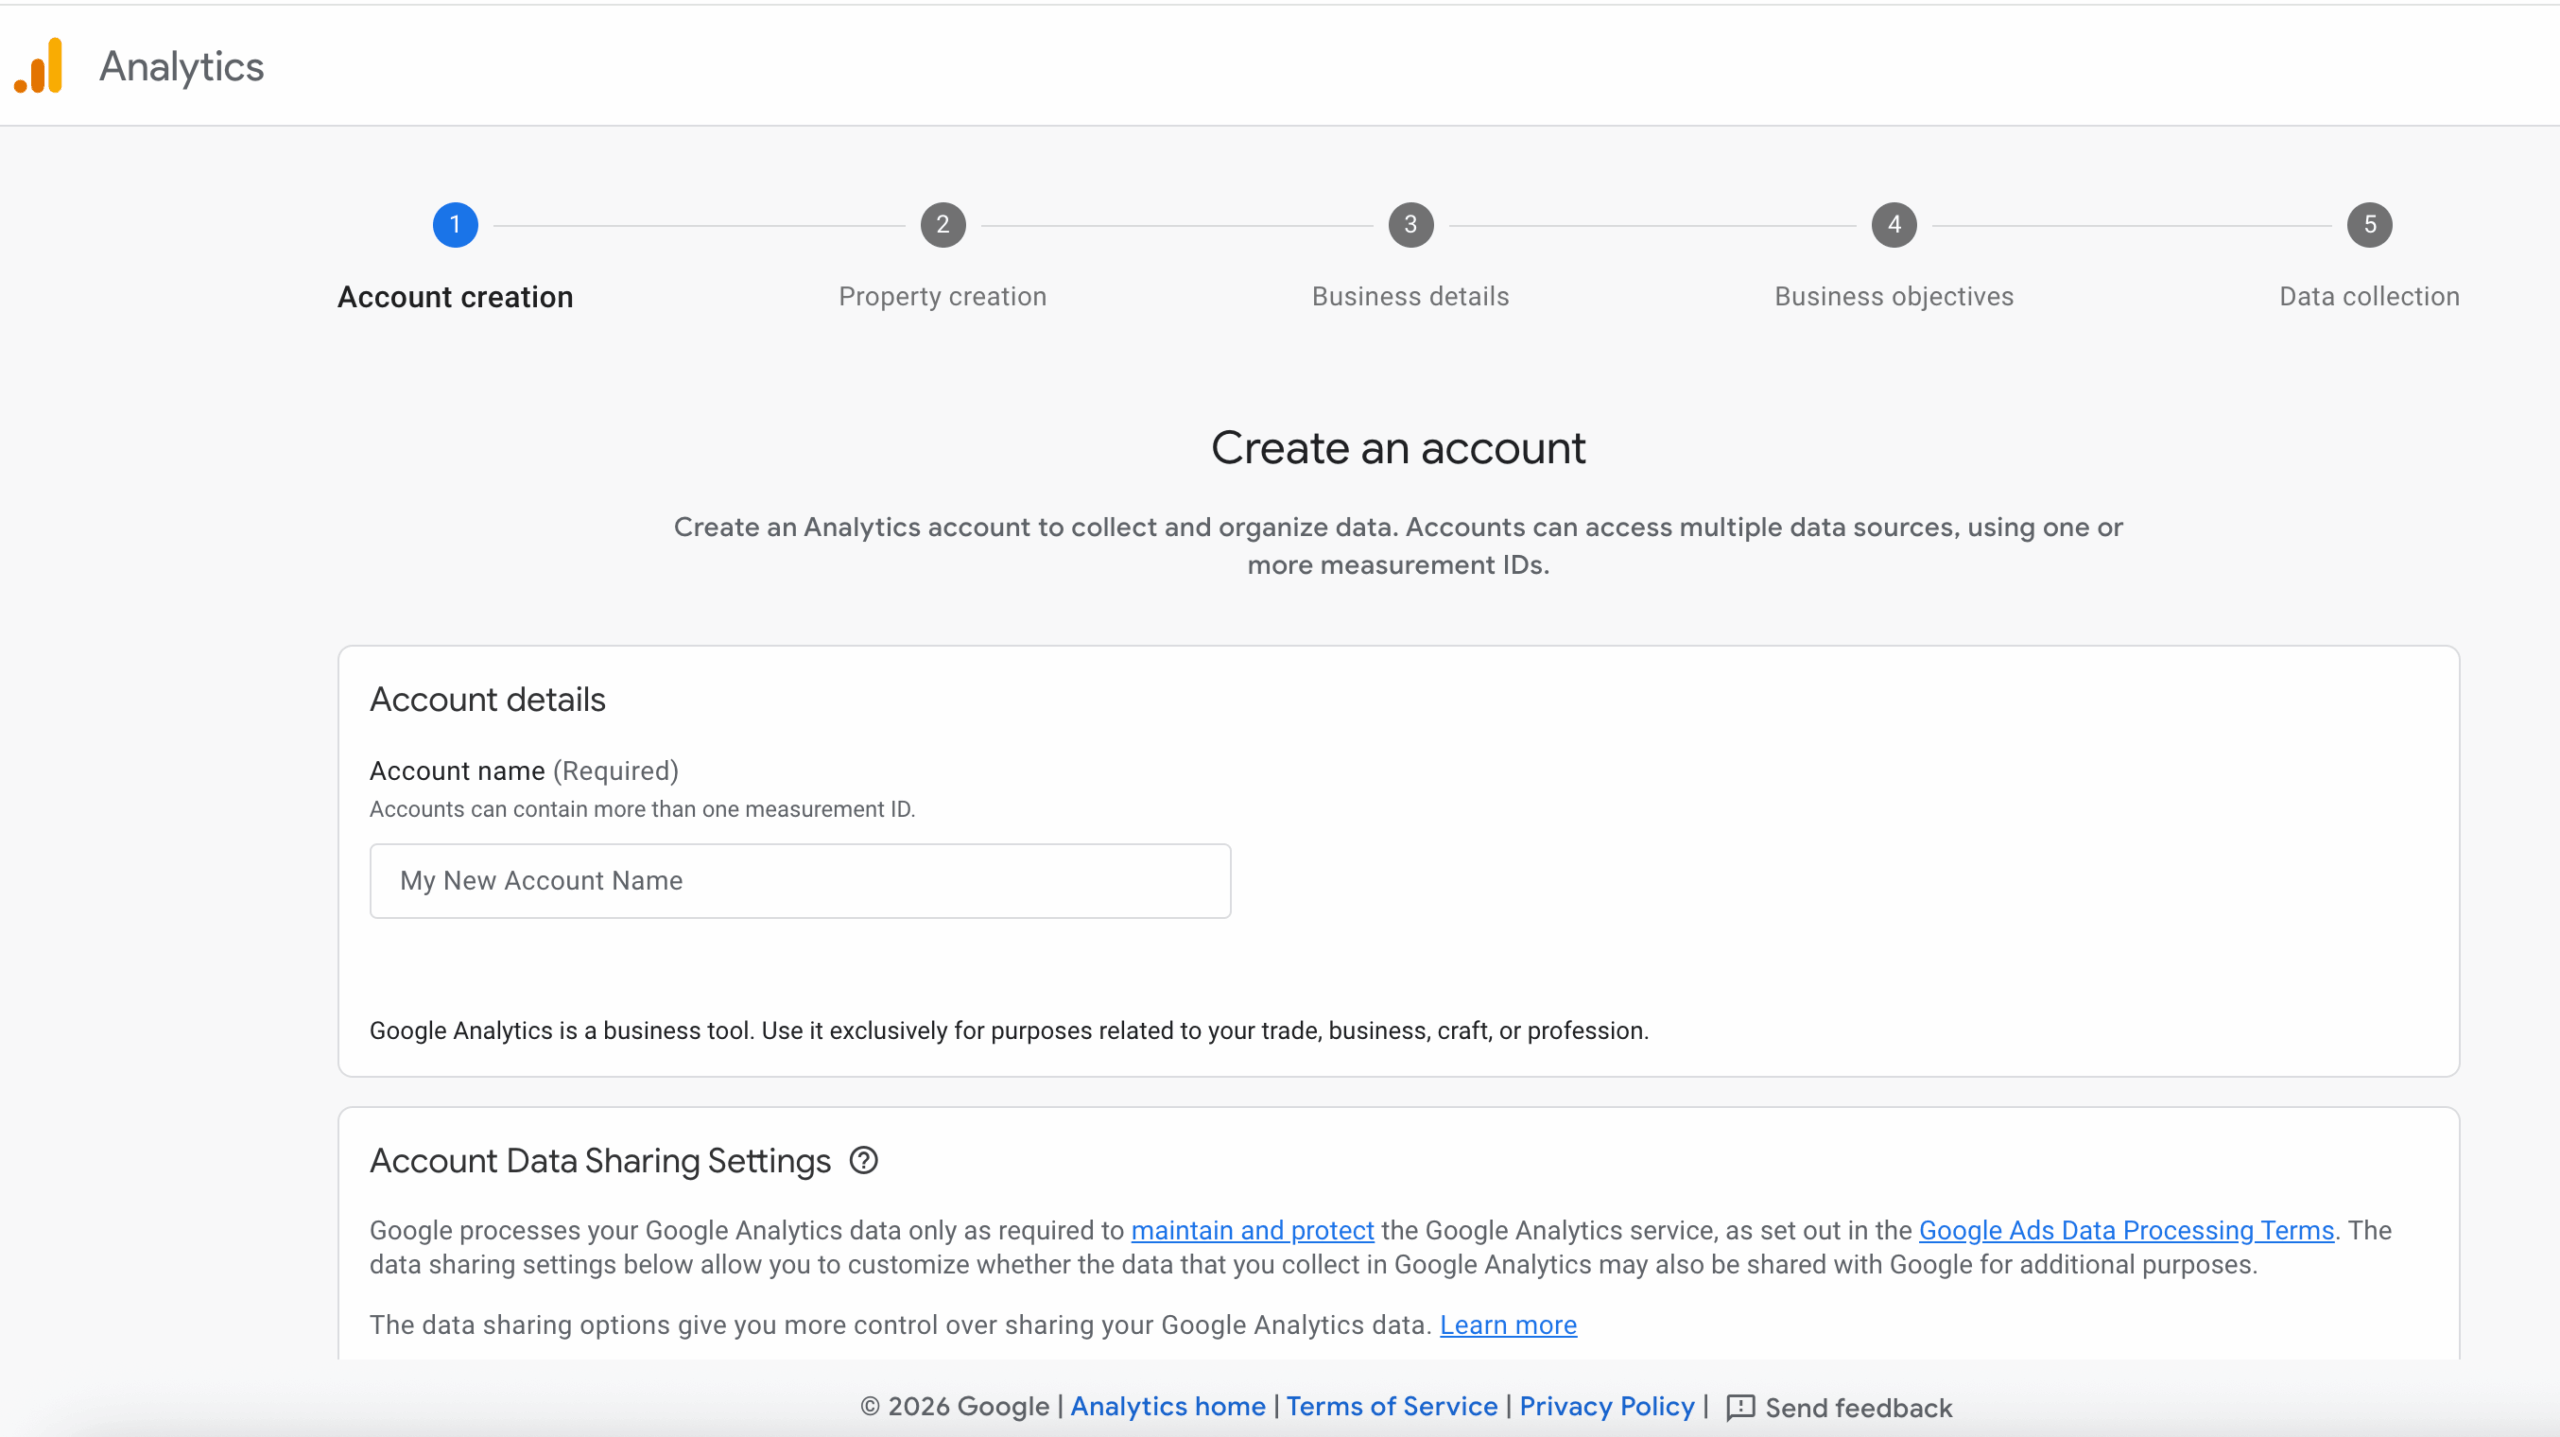
Best for: Teams that need a free, reliable baseline for on site and app behavior, funnels, and conversion analysis. It works best as a supporting layer alongside marketplace analytics, not a replacement for it.
Pricing: Google Analytics is free. Google Analytics 360 is paid and sold via sales or partners.
Key features
- Event based measurement for web and apps in one property.
- Explorations for deeper analysis like funnels and pathing.
- Predictive metrics like purchase probability.
- Native linkage with Google Ads for measurement and activation.
Triple Whale
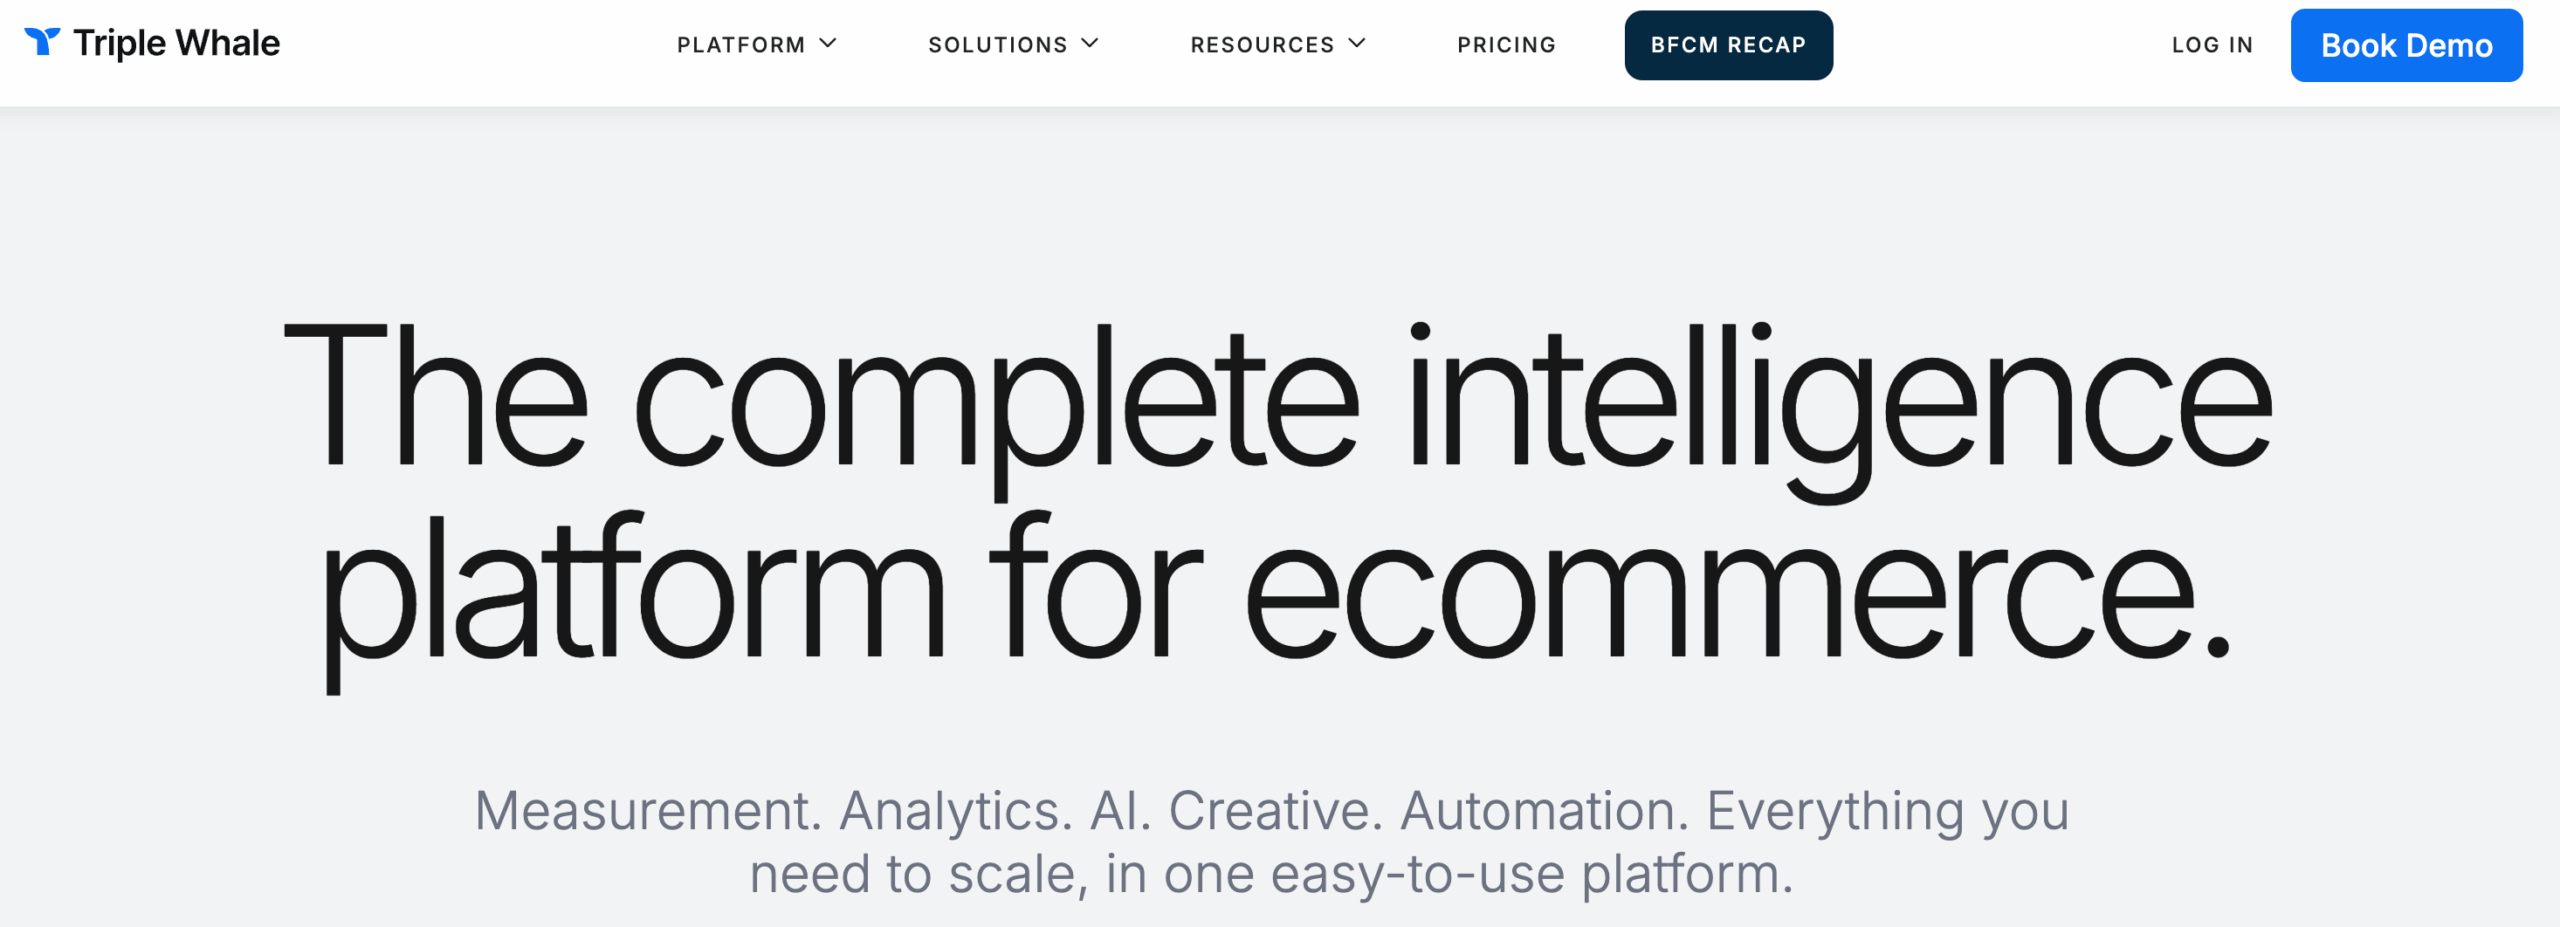
Best for: Shopify first DTC teams that want profit oriented reporting, attribution, and fast answers without stitching together a data stack. It is also common in agencies managing multiple DTC brands because the dashboards and workflows are built for daily marketing decisions.
Pricing: Free tier is available. Paid plans start at $149 per month for Starter and $219 per month for Advanced, with higher tiers and Enterprise custom pricing.
Key features
- Moby AI as the intelligence layer across the platform.
- Triple Pixel for first party data and identity resolution for attribution and journey tracking.
- Marketing Mix Modeling for forecasting and spend optimization.
- Built in BI and activation layer with audience syncing and advertising actions.
Glew
Best for: Mid market ecommerce teams that want broad reporting across channels, customers, products, and inventory without building a warehouse from scratch. It is strongest when you want lots of prebuilt dashboards and a unified commerce reporting layer.
Pricing: The pricing page emphasizes starting with a free trial and does not clearly list public plan pricing in the section shown.
Key features
- Hundreds of out of the box dashboards and visualizations across KPIs, customer, marketing, product, and inventory analytics.
- Prebuilt customer segments plus filtering and segmentation.Report builder and scheduled reports.
- Large integration footprint, advertised as 170 plus integrations and API capabilities.
Adobe Analytics
Best for: Enterprise teams that need highly configurable digital analytics across channels and journeys, and they have the implementation resources to fully instrument and govern it. It is often chosen when analytics needs extend beyond ecommerce reporting into enterprise wide customer experience measurement.
Pricing: Customized pricing and packaging, typically handled via sales.
Key features
- Unified customer analytics across data, content, and journeys via Adobe’s analytics product collection.
- Identity stitching in Customer Journey Analytics to unify people across channels and devices.
- AI driven insights including anomaly detection and algorithmic attribution.
- Analysis Workspace style analysis and visualization workflows.
Mixpanel
Best for: Product and growth teams who need event level analysis across web and apps, especially when they care about funnels, retention, and behavioral cohorts more than ecommerce specific margin and catalog reporting. It is a strong fit when you want self serve analysis without relying on SQL for every question.
Pricing: Pricing is event based. Mixpanel states 1M monthly events free and then $0.28 per 1K events after that, with additional billing details in docs.
Key features
- Core reports like Insights, Funnels, Flows, and Retention.
- Session Replay capabilities.
- Warehouse connectors for syncing data from common warehouses.
- Event based pricing model described in their billing documentation.
Matomo
Best for: Teams where privacy, compliance, and data ownership are non negotiable, and they want web and app analytics without sending data to Google. It is especially common in regulated industries or orgs with strict hosting requirements.
Pricing: Cloud pricing starts around €22 per month for a 50K hits tier on Matomo Cloud, and Matomo On Premise can be self hosted.
Key features
- Cloud hosted or self hosted options for data ownership.
- Privacy and compliance positioning, including GDPR focused controls.
- Includes tools like heatmaps and session recording in Matomo’s platform offering.
- Pricing tiers and deployment options clearly split between Cloud and On Premise.
Supermetrics
Best for: Marketing and analytics teams that already use Sheets, Looker Studio, Power BI, or a warehouse and just need clean pipelines to centralize reporting inputs. It is a go to choice for agencies because it standardizes cross channel data without custom connectors.
Pricing: Pricing starts at $47 per month on the Starter package, with monthly or yearly billing options shown.
Key features
- Connect and manage marketing data across sources as a marketing intelligence platform.
- Automatic cleaning, organizing, and standardizing of data.
- Package based pricing model with clear tiers on the pricing page.
- Positioning includes activation, meaning sending insights back into marketing platforms.
Optimizely
Best for: Teams running structured experimentation programs who want to test, learn, and roll out winners across web experiences at scale. It fits orgs that treat experimentation as a core growth lever and want tooling plus governance, not just a basic A B test script.
Pricing: Custom pricing and request a quote model.
Key features
- Web experimentation via A/B and multivariant testing.
- Implementation described as adding a snippet for Web Experimentation.
- Advanced audience targeting is highlighted in product updates.
- Developer resources for managing experiments and feature flags across experimentation products.
Woopra
Best for: Teams who want customer journey visibility across touchpoints, with the ability to segment behavior and trigger actions based on what users do. It is most useful when you care about lifecycle paths and event timelines, not ecommerce catalog depth.
Pricing: Woopra lists a free Core tier and paid tiers that scale up to Pro and Enterprise on their pricing page.
Key features
- Journey style reporting and lifecycle analysis features are core to the platform positioning.
- People level profiles and event timelines are central to how it works.
- Automations and triggers are part of the value proposition described in the pricing and plan structure.
- Tiered plans from free to enterprise scale.
Turn your marketplace analytics into actionable insights with DataHawk
If Amazon and Walmart are meaningful revenue channels for you, the marketplace layer is where small changes can create a significant impact.
If you want marketplace analytics to drive action, you need three things: a clear and accurate source of truth, fast alerts when something changes, and a consistent process for turning signals into decisions.
1. Start by deciding which KPIs actually define success for your business. For most Amazon and Walmart teams, that means a short list that combines sales and profit signals with visibility signals, like keyword performance and share of voice. DataHawk keeps those metrics in one place so everyone is working from the same numbers.
2. Next, set alerts around the changes that matter. You should know when performance drops, when visibility slips, when a key SKU goes out of stock, or when a competitor adjusts pricing. Instead of finding out in a weekly report, DataHawk flags the change early so the team can respond while the impact is still recoverable.
3. Finally, build a simple review rhythm. Use DataHawk dashboards to spot trends, then assign owners, and track whether the fix worked. The payoff is straightforward. You spend less time stitching data, you catch issues quickly, and you’re able to move faster when the marketplace shifts.
Book a free demo today with our marketplace specialists and see how DataHawk helps you improve this process and own the digital shelf.