If you run Amazon Ads at scale, the hard part isn’t finding numbers. It’s getting numbers you trust, quick enough to act on them.
Spend and clicks sit in the Amazon Ads console. Organic visibility sits somewhere else. Profit lives in finance reports. Agencies and internal teams end up arguing about whose dashboard is right instead of fixing what is actually driving performance. That is what Amazon advertising analytics is meant to solve.
Key takeaways
- Amazon advertising analytics connects ad delivery, search term performance, and outcomes like sales and new customer growth so teams can make decisions with confidence.
- If you only look at ROAS or ACoS, you can miss what is happening at the top of search and on the digital shelf. Amazon now gives specific visibility metrics like top of search impression share and search term impression share to help close that gap.
- The best reporting setups separate three layers: visibility, efficiency, and profitability. Then they make those layers easy to review weekly and daily.
What Amazon advertising analytics actually includes
Amazon advertising analytics is the practice of measuring what your Amazon Ads investment is doing across awareness, consideration, and purchase, then connecting it back to business outcomes. At a minimum, that means you are analyzing performance by campaign, ad type, and search term, not just at the account level.
For most enterprise brands and agencies, it usually expands into:
- Retail search visibility metrics: Like top of search impression share and search term impression share, so you can see if you are winning the placements that matter.
- AI Discovery Signals: Tracking how your products appear in AI-generated shopping prompts (like Rufus) to ensure your content is “RAG-ready” (Retrieval-Augmented Generation) for Amazon’s AI.
- New customer measurement: Like new-to-brand (NTB) metrics, so you know whether spend is creating incremental growth or just harvesting existing demand.
- Attribution Nuance: A view of the shopping-signal enhanced last-touch attribution (introduced Jan 1, 2026). This update specifically filters vCPM-based Sponsored Brands, Sponsored Display, and DSP views. It replaces the old “passive” 14-day window with a stricter model that only credits views showing genuine influence, like a subsequent brand search or Store visit.
Pro Tip: To bridge the gap during this transition, always compare your standard Purchases with the new Purchases (all views) metric. If your standard ROAS looks 15–30% lower than “all views,” it’s likely a reporting shift, not a drop in ad effectiveness.
Who benefits the most from advertising analytics
- Agencies need a consistent way to compare accounts, explain performance shifts, and justify budget changes without rebuilding reports every week.
- Enterprise brands and advertisers need dependable, daily visibility across large catalogs, plus a clean executive view that ties spend to outcomes.
- Executive and finance decision makers need a version of truth that holds up in a meeting, including clarity on efficiency metrics like ACoS and visibility metrics like impression share.
- Advertising Account Managers need CPC and performance monitoring to maximize campaign reach and profitability.
The metrics that actually move decisions
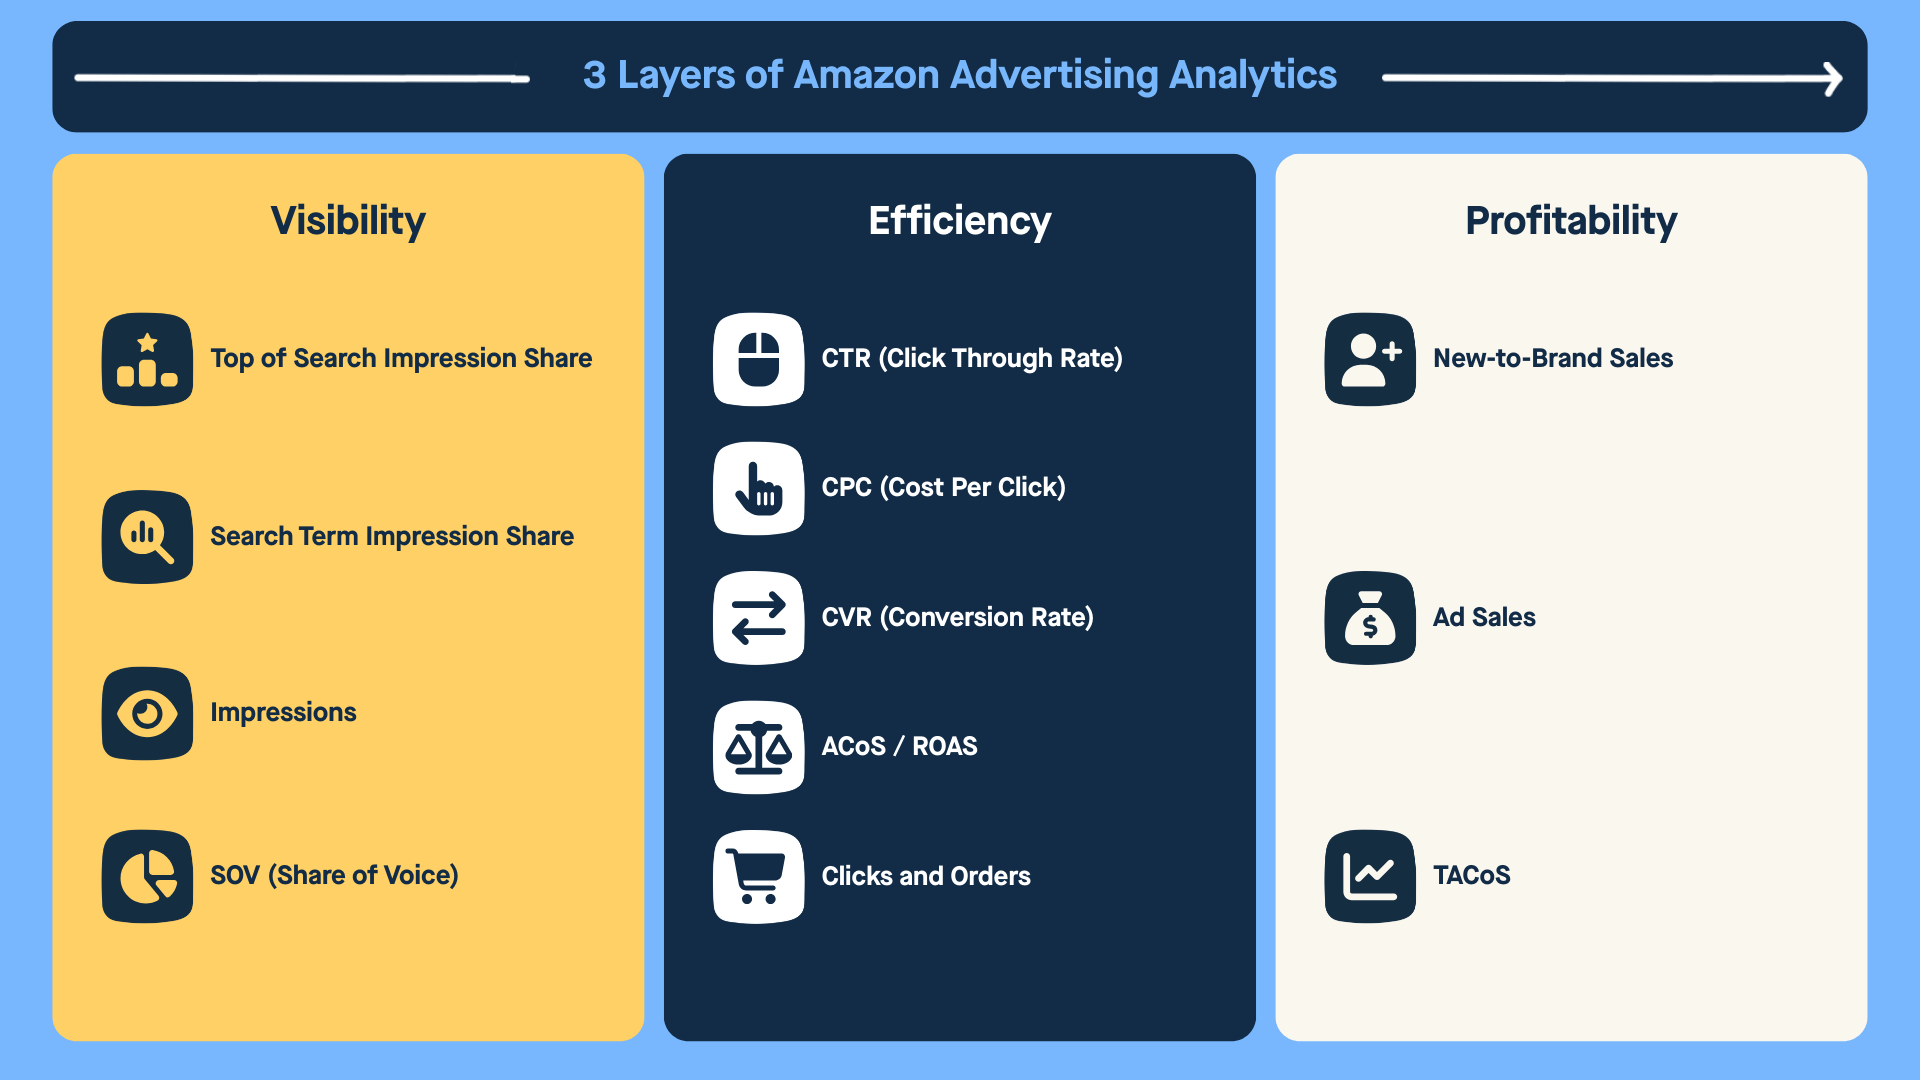
Here is a practical way to structure your reporting so it maps to real questions.
1. Visibility metrics
These metrics tell you whether you are showing up in the auctions and ad placements that actually drive volume.
- Top of search impression share: The percentage of top of search impressions your campaign earned out of the total it was eligible for.
- Search term impression share: Your share of Sponsored Products impressions for a specific search term compared to other advertisers over the selected period.
- Impressions: How often your ads are shown. This sets the baseline for understanding reach and auction presence.
- Share of voice: A simple way to talk about visibility across your priority keywords, using metrics like top of search and search term impression share as the inputs.
Use these when someone asks: Are we losing ground on our most important queries, or are we simply less visible than before?
2. Efficiency metrics
These metrics tell you whether your ad spend is turning visibility into meaningful engagement and sales.
- CTR (click through rate): How often shoppers click your ad after seeing it. A signal of relevance and creative fit.
- CPC (cost per click): The average price you pay for each click. Reflects auction pressure and bidding efficiency.
- CVR (conversion rate): The percentage of clicks that turn into orders. Indicates listing quality, pricing, and intent alignment.
- ACoS (advertising cost of sale): Ad spend divided by ad attributed sales. Shows how efficiently ads generate revenue.
- ROAS (return on ad spend): Ad attributed sales divided by ad spend. The inverse of ACoS, often used in executive reporting. Note: In 2026, always compare your standard ROAS to “ROAS (all views)” to audit the impact of Amazon’s shopping-signal attribution filters.
- Clicks and orders: The raw inputs behind efficiency. Clicks show traffic quality. Orders show whether that traffic converts.
Use these when someone asks: Are we paying too much for traffic, or is the traffic fine but conversion is the issue?
3. Growth and incrementality signals
These metrics tell you whether advertising is expanding the business or just redistributing demand.
- New to brand sales: Purchases made by customers who have not bought from your brand in the last 365 days.
- Ad sales: Total revenue attributed to ads. Useful for understanding scale, but only meaningful when viewed alongside NTB and efficiency.
Use these when someone asks: Are we actually acquiring new customers, or just bidding harder on shoppers who already know us?
4. Profitability framing
This is where advertising performance connects back to the business.
- TACoS (total advertising cost of sale): Ad spend divided by total sales, not just ad attributed sales. It forces the conversation away from isolated ad efficiency and toward overall business health.
Amazon itself positions ACoS as an efficiency metric and TACoS as the broader lens for understanding whether advertising is supporting sustainable growth.
Use this when someone asks: Are we growing total sales in proportion to spend, or are we spending more just to stand still?
What a strong Amazon Ads dashboard looks like in 2026
A dashboard that ranks is not the one with the most widgets. It is the one that answers questions quickly and accurately.
A solid structure is:
- One executive view: total spend, attributed sales, organic vs paid sales (and the trend/ratio between them), ACoS, top of search impression share, and new to brand trend.
- One operator view: search term impression share, keyword and search term movement, placement shifts, and SKU level outliers.
- One diagnostic view: what changed this week, what changed yesterday, and which campaigns or SKUs drove the change.
This is also where a lot of teams get stuck, because Amazon ads data is only one piece of the puzzle.
Where DataHawk fits for Amazon advertising analytics
If Amazon is an important revenue channel, you need analytics that connect ads to what is happening across the digital shelf. DataHawk serves as that central operating system, bridging the gap between raw data and actionable strategy:
- Unified Multi-Channel Dashboards: Bring Amazon and Walmart ad KPIs into one place, with the unique ability to layer in organic analytics in the same view for a total business perspective.
- AI-Powered Anomaly Detection (Insights): DataHawk continuously monitors key metrics and automatically flags anomalies when it spots irregular or unexpected changes, so you can address quickly without digging through reports manually.
- Deep Keyword Visibility: Use a dedicated keyword grid that shows impressions, clicks, CPC, spend, and sales together. This allows you to spot exactly which terms are gaining or losing traction.
- ASIN-Level Profit Overlays: Go beyond ROAS by factoring in operational costs and ad spend at the ASIN level. The integrated ad and organic view shows your true total contribution margin across every campaign.
- One-Click Executive Reporting: Instantly generate reports at the campaign, ASIN, or portfolio level. Seamlessly connect your data to Power BI, Tableau, and Google Sheets for professional, automated presentations.
- Historical Trend Visibility: Access daily-level charts with a data sync that starts with 60 days of historical data on day one and automatically backs up new data every 24 hours to prevent data loss.
A simple weekly rhythm that works for agencies and exec reviews
- Start with visibility. Check top of search impression share and search term impression share on your priority queries. If visibility slipped, do not waste the meeting debating ACoS yet.
- Then check efficiency. Look at CTR, CPC, and ACoS to see whether the issue is traffic quality, auction pressure, or conversion.
- End with business impact. Bring it back to growth signals like new to brand and your profitability framing so leadership understands the tradeoff you are making.
Final Thoughts on Advertising Analytics
If you want Amazon advertising analytics that drives action, keep it simple. Build a single source of truth for visibility, efficiency, and profitability. Review it on a regular basis so your team can actually sustain. Then make sure the reporting is clear enough that agencies, operators, and executives all trust the same numbers.
Book a free demo today with our marketplace specialists to see how DataHawk can improve your Amazon advertising analytics process and help you own the digital shelf.